Introducing HAMi WebUI: GPU Monitoring Dashboard for Kubernetes
Managing GPU resources in Kubernetes has long been a "blind spot" for operators. You know GPUs are being used, but answering questions like "which node has idle capacity?", "is this workload actually utilizing its allocated GPU?", or "what's the overall cluster utilization trend?" often requires piecing together kubectl get, Prometheus PromQL, and log output.
Today, the HAMi community is introducing HAMi WebUI — an open-source GPU monitoring dashboard that puts your entire GPU cluster into a single, visual interface.
HAMi WebUI v1.1.0 is now available as the first official major release, and we invite you to try it.
Together with the core HAMi scheduler, WebUI completes the full loop: from GPU scheduling to visual observability.
The Challenge of GPU Monitoring in Kubernetes
HAMi, a CNCF Sandbox project, has long been focused on the scheduling and management layer of GPU resources in Kubernetes. The scheduler decides which GPU a workload gets — but once workloads are running, understanding what's happening at the resource level has been far from straightforward.
Consider a typical day-to-day scenario:
- A team lead wants to know if there's room to schedule another training job.
- An SRE receives an alert about high GPU memory usage and needs to pinpoint the source.
- A cluster admin wants to compare GPU utilization across nodes to rebalance workloads.
Without a visual tool, each of these tasks requires switching between multiple terminal windows and manually correlating data from different sources. HAMi WebUI was built to solve exactly this problem — it is a purpose-built GPU monitoring dashboard for Kubernetes.
What Is HAMi WebUI?
HAMi WebUI is the visualization component in the HAMi ecosystem. While HAMi handles GPU resource scheduling and management, WebUI is responsible for data presentation and user interaction.
It provides a unified GPU monitoring experience centered on GPU resources, enabling operators to:
- Understand GPU cluster status at a glance
- Analyze GPU utilization patterns and trends over time
- Quickly locate issues and optimize GPU resource allocation
Architecture
HAMi WebUI adopts a frontend-backend separation architecture with three layers:

| Layer | Technology | Role |
|---|---|---|
| Client Side | Vue 3 SPA + Axios | Browser-based dashboard UI |
| Frontend Proxy | NestJS (BFF) | Static asset hosting + API reverse proxy |
| Backend | Go (Kratos framework) | API server, queries Prometheus for metrics |
The frontend communicates with the backend through a unified /api/vgpu/* endpoint, proxied by the NestJS BFF layer. GPU metric data is sourced from Prometheus, which collects GPU usage telemetry from HAMi-managed nodes.
Core GPU Monitoring Capabilities
Cluster Overview
The cluster overview page provides a quick summary of the overall running status, including GPU resource usage, node status, and key metric trends with time range filtering.
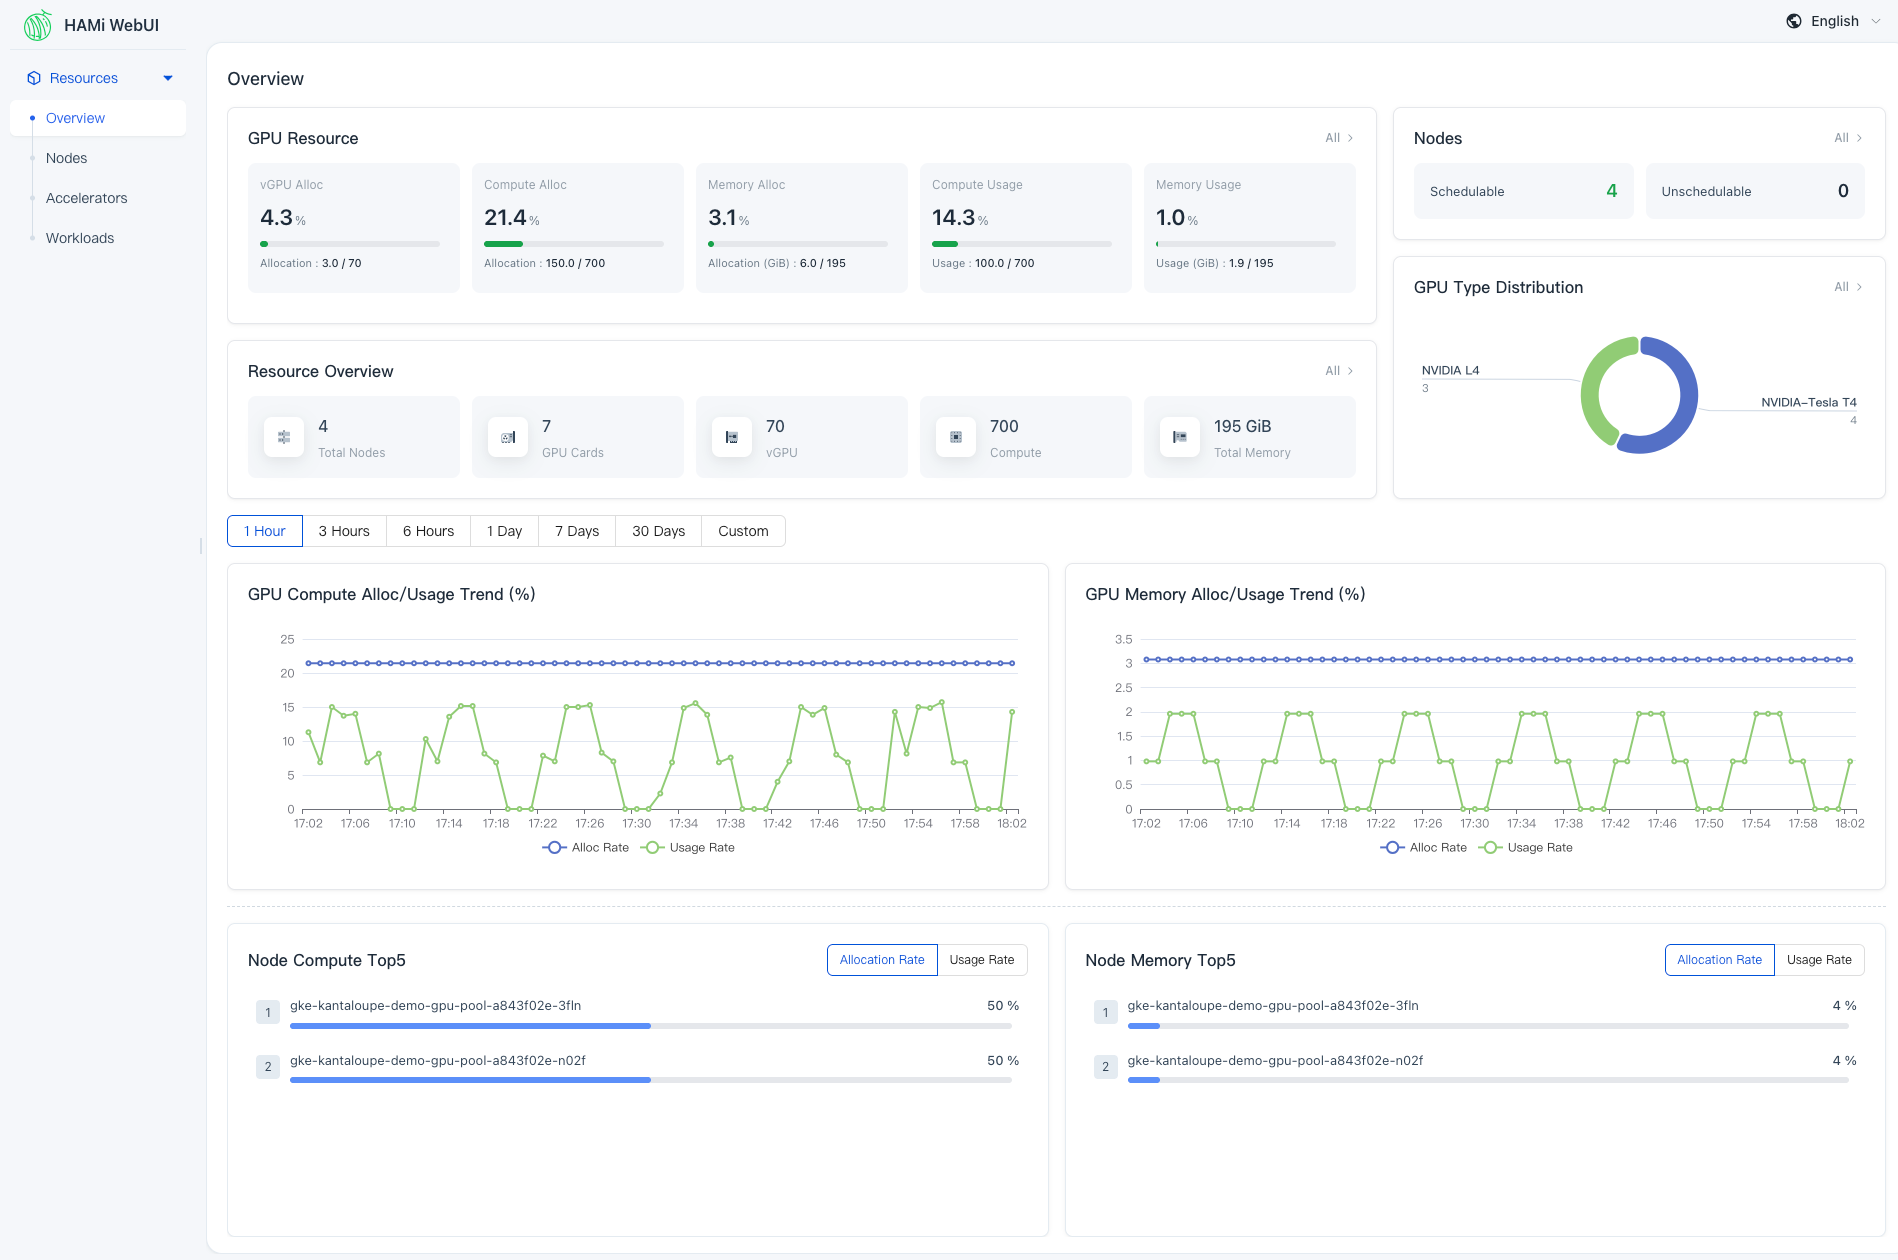
Key metrics support drill-down navigation — for example, clicking on "Schedulable" takes you directly to the node management page filtered by that state. You can grasp the global GPU cluster status on a single page.
Node Management
The node-level view shows GPU allocation and usage per node, along with workload distribution. This helps operators compare GPU resource usage across nodes and identify imbalances.
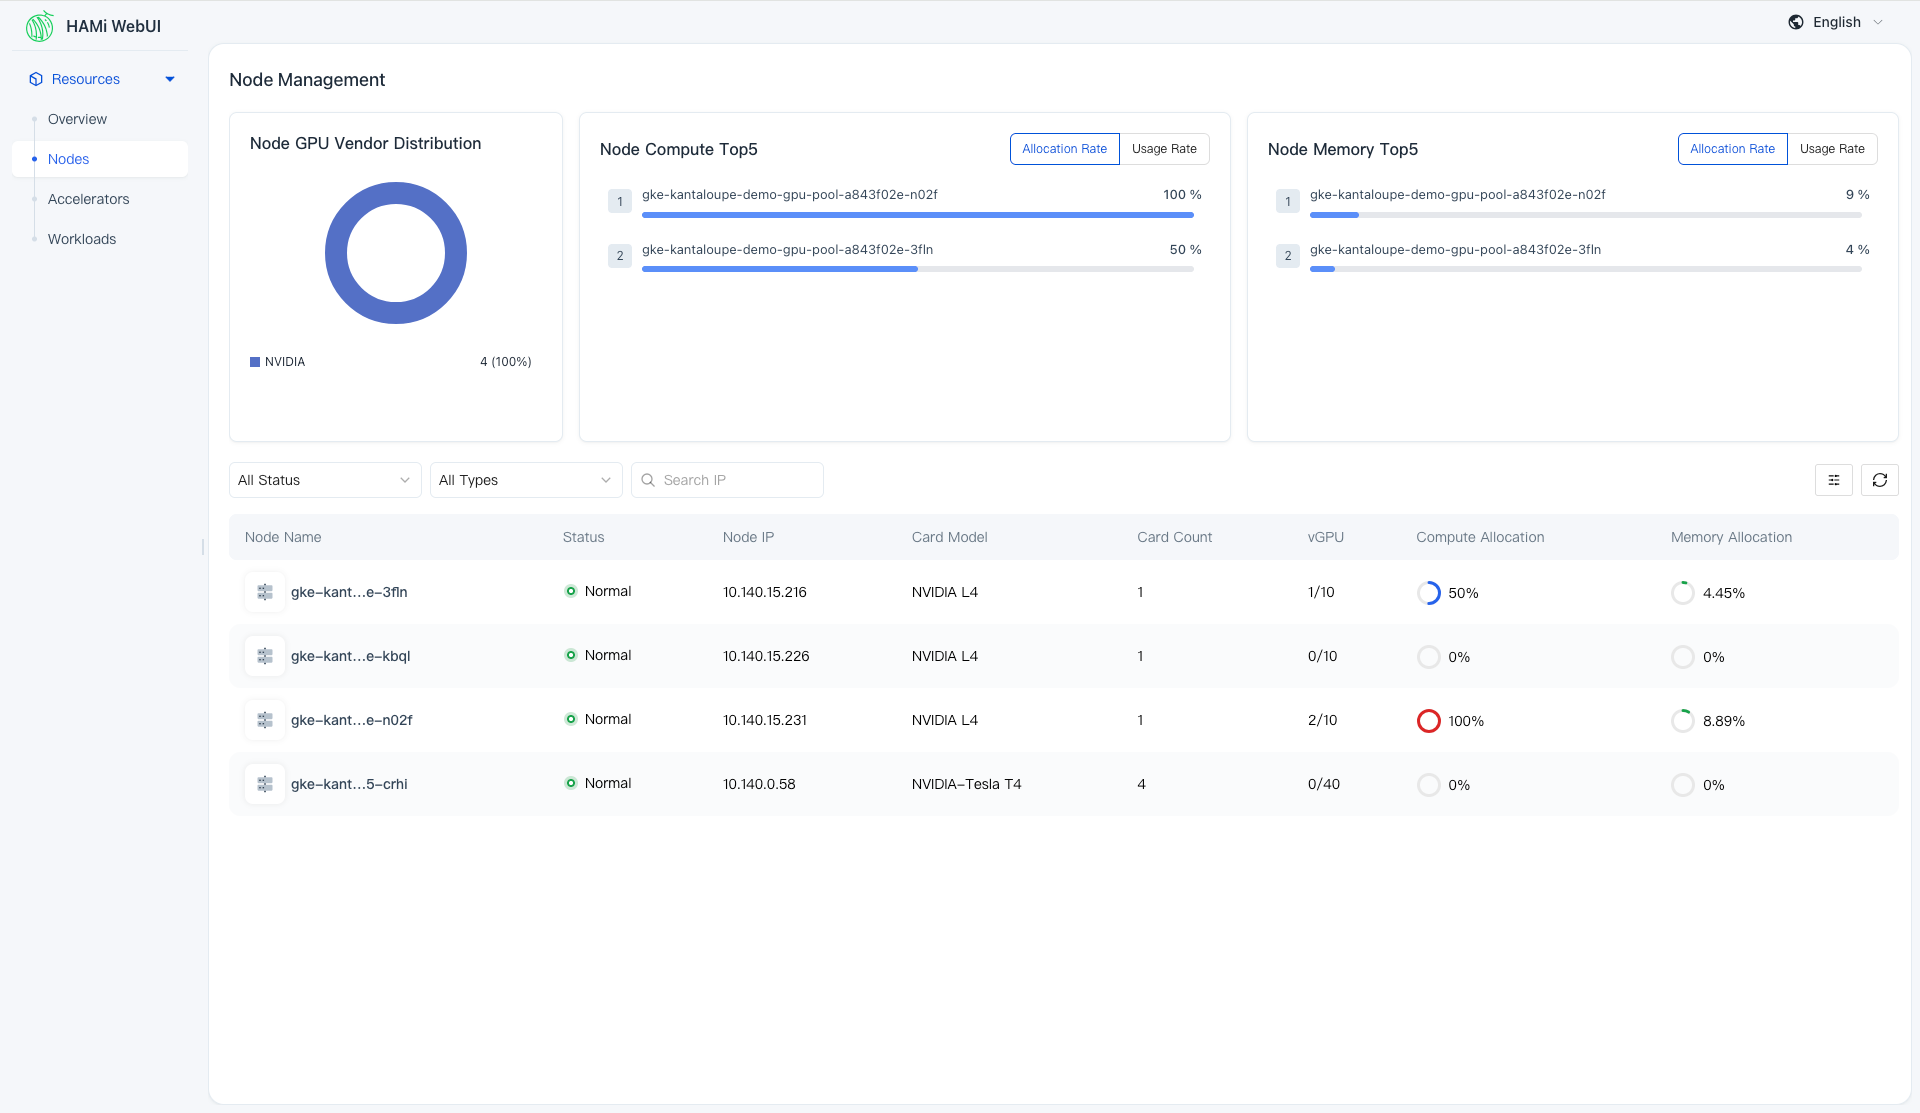
On the node details page, you can further inspect GPU usage and task distribution on a specific node to better understand load distribution.
GPU/Accelerator Management
From the accelerator perspective, WebUI supports fine-grained inspection of each GPU card — including allocation status, utilization, memory usage, and node association.
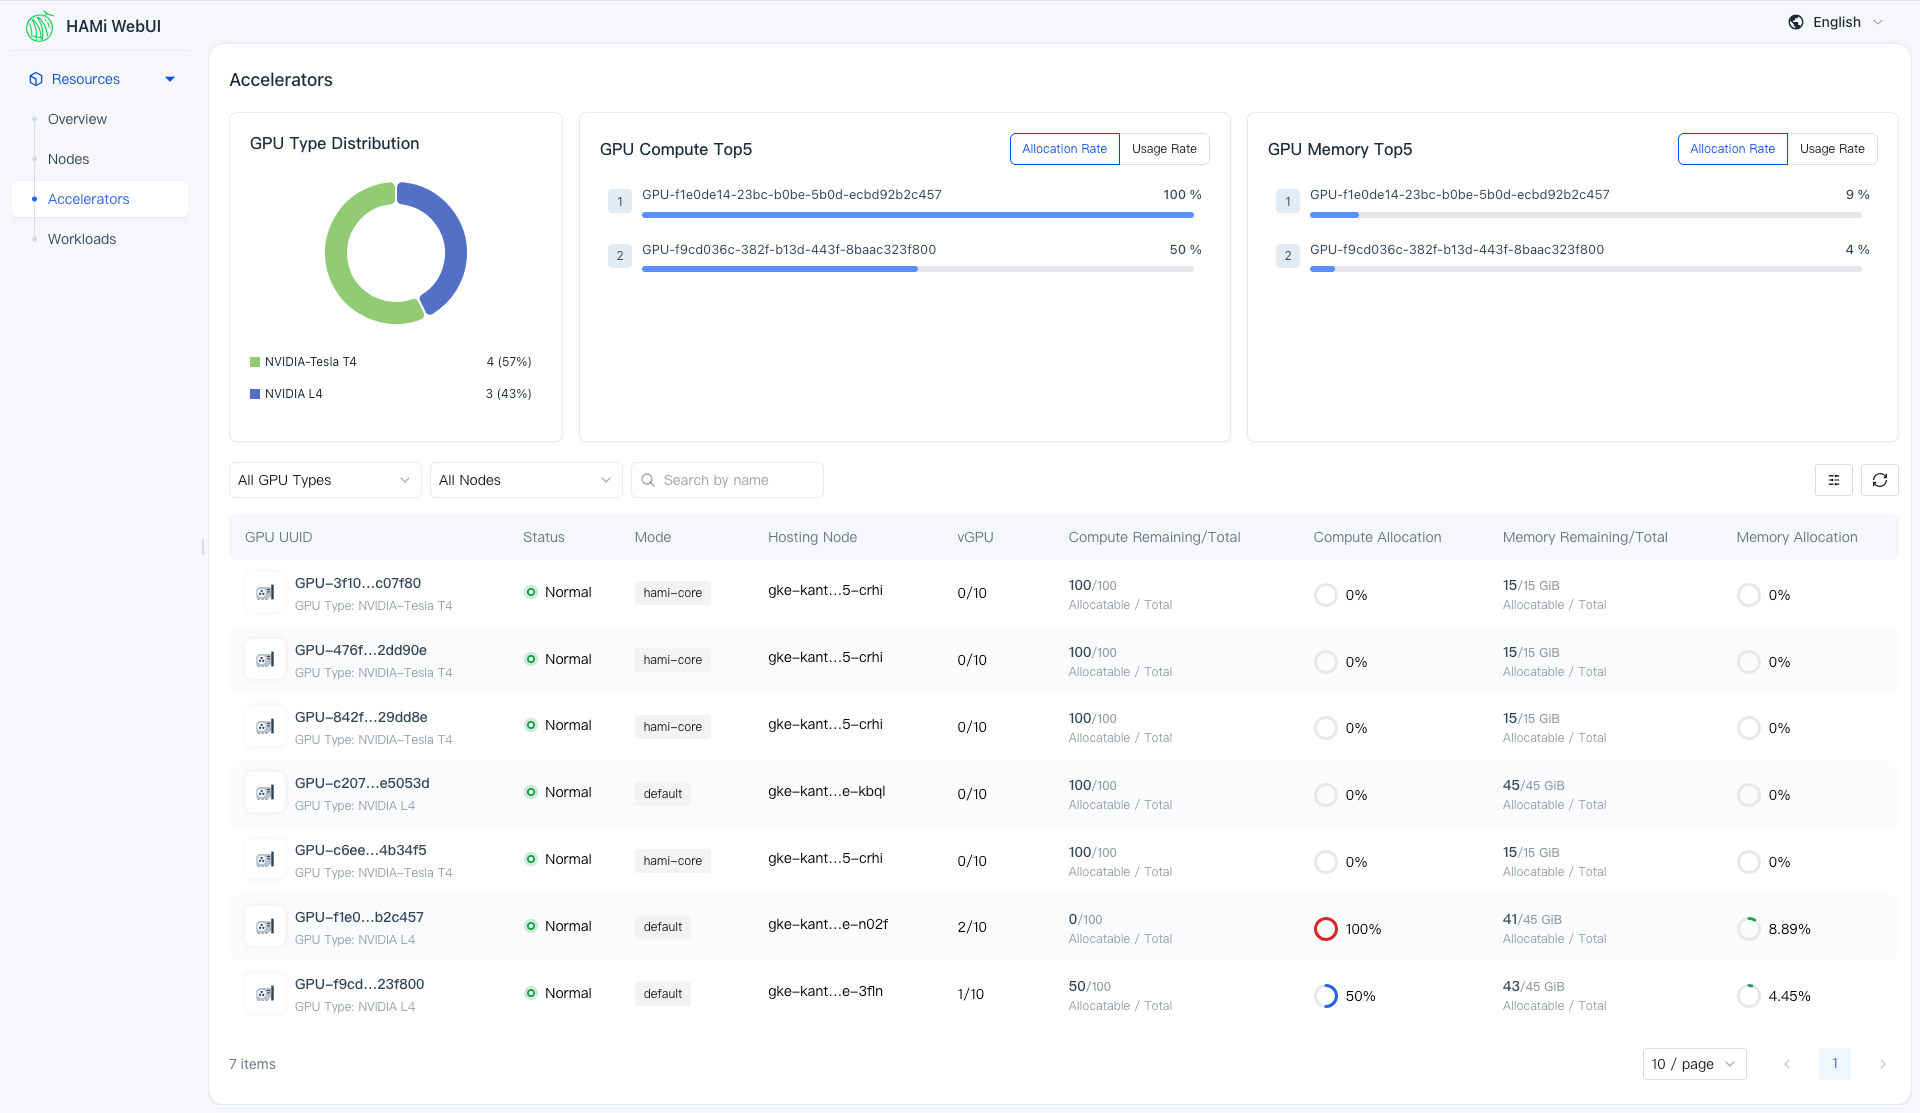
This helps you understand how GPU compute and memory resources are allocated and consumed across the cluster.
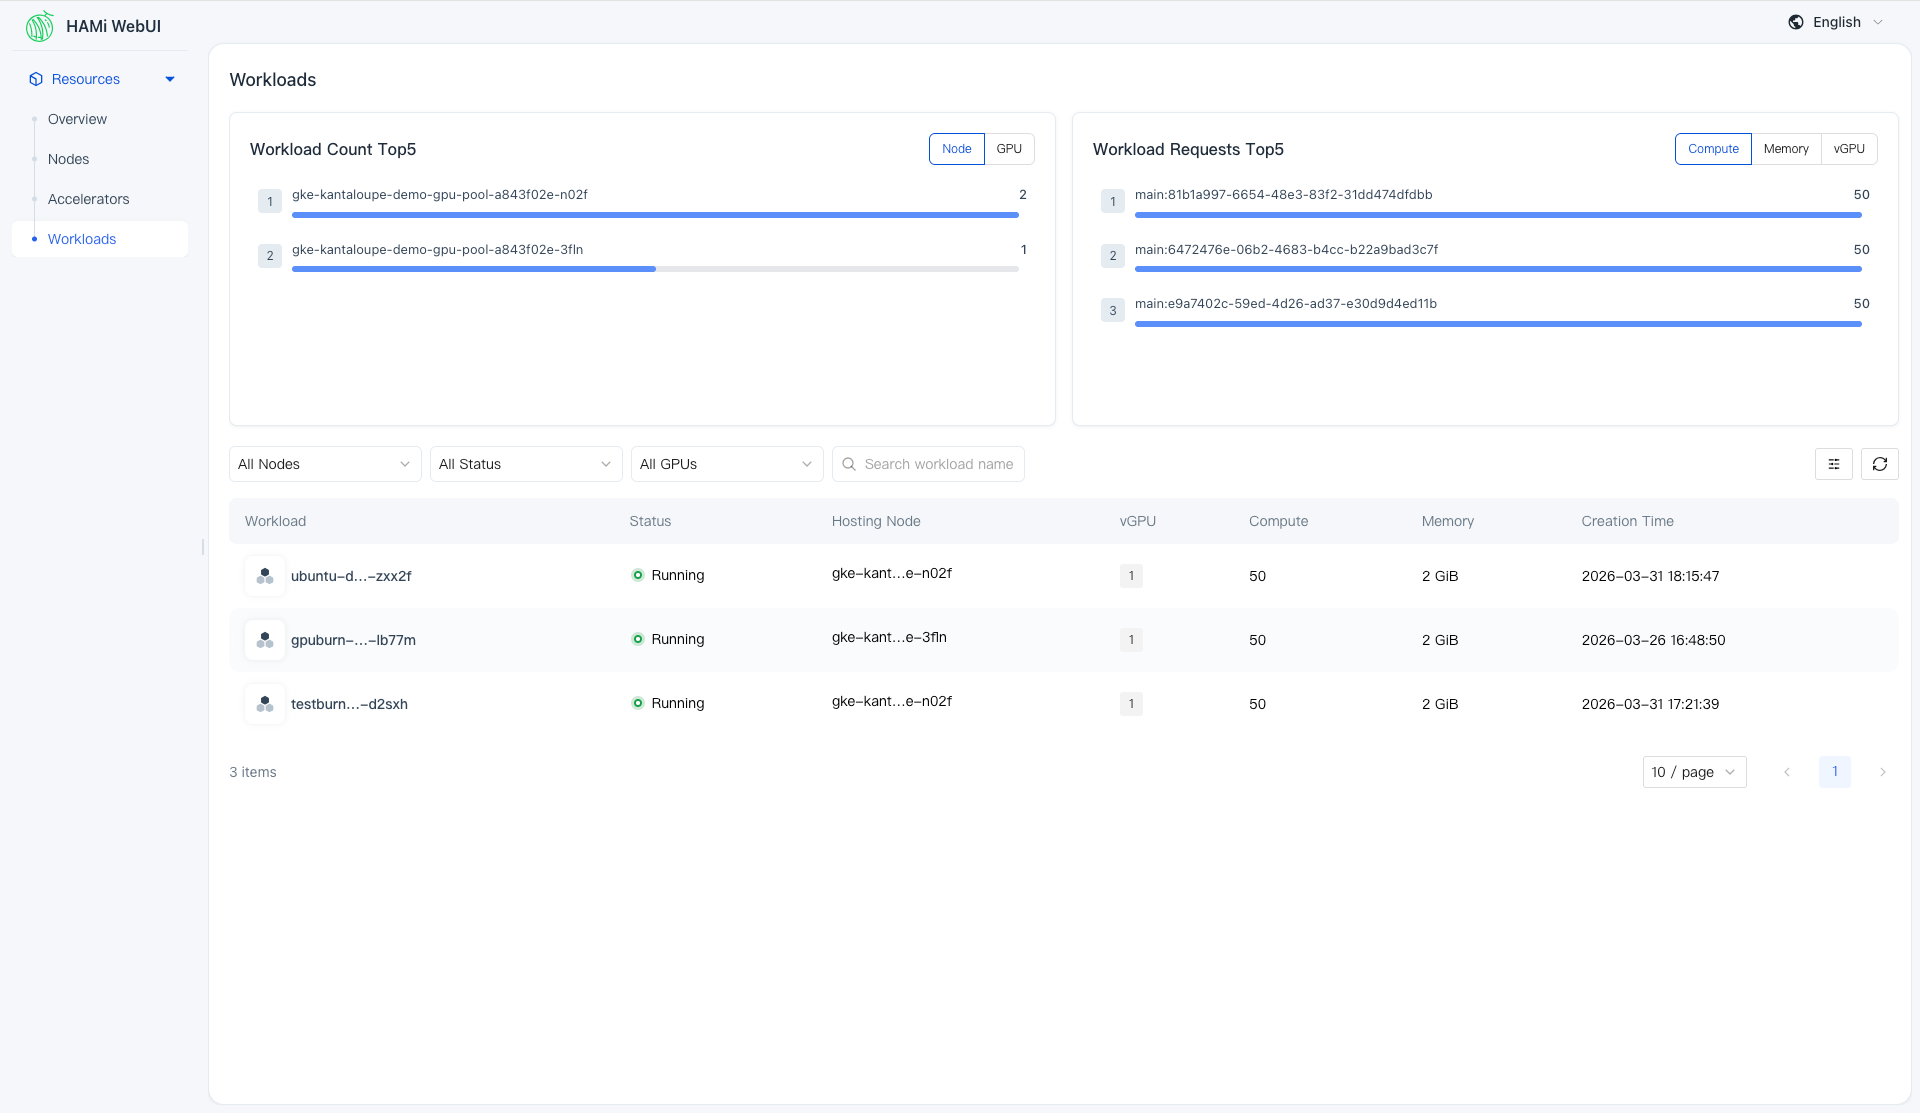
Workload Tracking
From the workload perspective, operators can view GPU usage, resource allocation details, and runtime status for each workload, making it easier to correlate workload behavior with cluster GPU resource consumption.
Who Is HAMi WebUI For?
HAMi WebUI is designed for anyone who operates or interacts with GPU clusters managed by HAMi:
- Cluster administrators who need a high-level view of GPU resource health and utilization
- Platform engineers who troubleshoot GPU resource allocation issues and optimize cluster efficiency
- AI/ML team leads who want visibility into how their training and inference workloads consume GPU resources
- SREs who need quick access to GPU metrics for monitoring and alerting context
Getting Started with HAMi WebUI
Deploying HAMi WebUI is straightforward using Helm. You need:
- HAMi >= 2.4.0
- Prometheus > 2.8.0
- Helm > 3.0
# Add the Helm repository
helm repo add hami-webui https://project-hami.github.io/HAMi-WebUI

# Install HAMi WebUI
helm install my-hami-webui hami-webui/hami-webui \
  --set externalPrometheus.enabled=true \
  --set externalPrometheus.address="http://<your-prometheus-service>:9090" \
  -n kube-system

# Port-forward to access the UI
kubectl port-forward service/my-hami-webui 3000:3000 --namespace=kube-system
Then open http://localhost:3000 in your browser.
For detailed instructions, refer to the HAMi WebUI Installation Guide.
Documentation
The HAMi community has prepared comprehensive documentation:
- WebUI User Guide — Learn how to use the cluster overview, node management, GPU management, and workload tracking features.
- WebUI Developer Guide — Understand the architecture, repository structure, local development setup, and coding conventions for contributing to WebUI.
Join the HAMi Community
HAMi WebUI is an active and evolving project. v1.1.0 already brings internationalization support (English and Chinese), multi-architecture container images, and broader device vendor compatibility.
We welcome contributions of all kinds — bug fixes, feature requests, documentation improvements, and new ideas. Check out the HAMi-WebUI repository and the Developer Guide to get started.
See the v1.1.0 release notes for the full list of changes.
Links:
